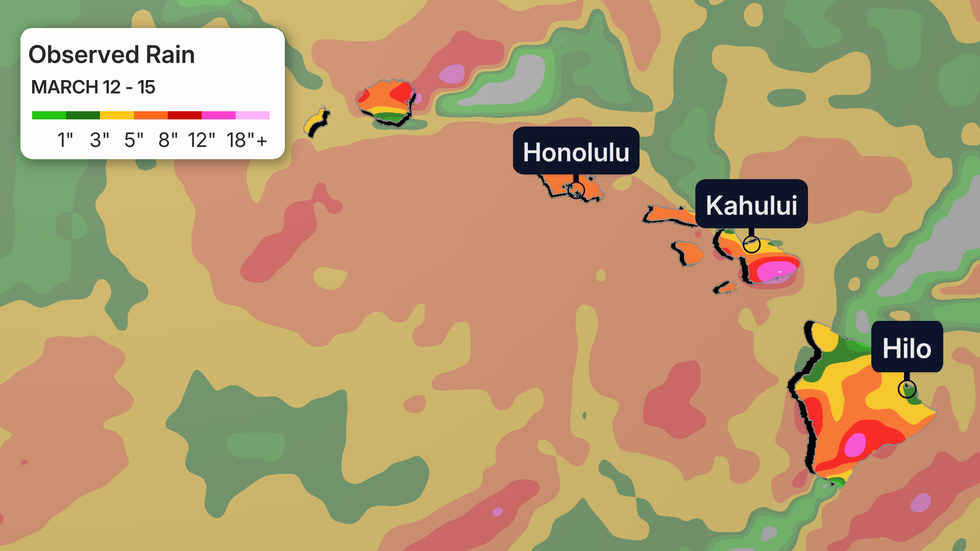
This image shows observed rainfall totals across Hawaiʻi from March 12–15, 2026, during a powerful Kona low storm that brought flooding rain and strong winds to the islands. Some high elevation areas reportedly received more than a meter of rain in three days.
This rainfall accumulation map, created by combining measurements from rain gauges, weather and satellite data, and weather models, estimates how much rain fell across the state.
Each color represents a different rainfall total. Greens and yellows indicate a few inches of rain, while reds and pinks show areas that received more than a foot of rainfall over several days. The map highlights especially heavy totals on parts of Hawaiʻi Island and Maui, where intense downpours led to flash flooding concerns.
The storm responsible for this rainfall was a Kona low, an unusual low-pressure system that forms to the west or northwest of the Hawaiian Islands. From this position, the storm pulls deep tropical moisture northward and spreads it across the state, often producing widespread heavy rain, strong winds, thunderstorms, and hazardous conditions.
Kona lows are unusual because they reverse Hawaiʻi’s typical weather pattern. Under normal conditions, steady trade winds blow from the northeast, bringing more rain to windward areas such as Hilo. But when a Kona storm develops, winds shift and blow from the southwest—the “kona” side of the islands. This change allows storms to drench places that are normally much drier, including Honolulu and the Kona coast of the Big Island.
Learn more here.
Visualization from CIRA-CSU here.